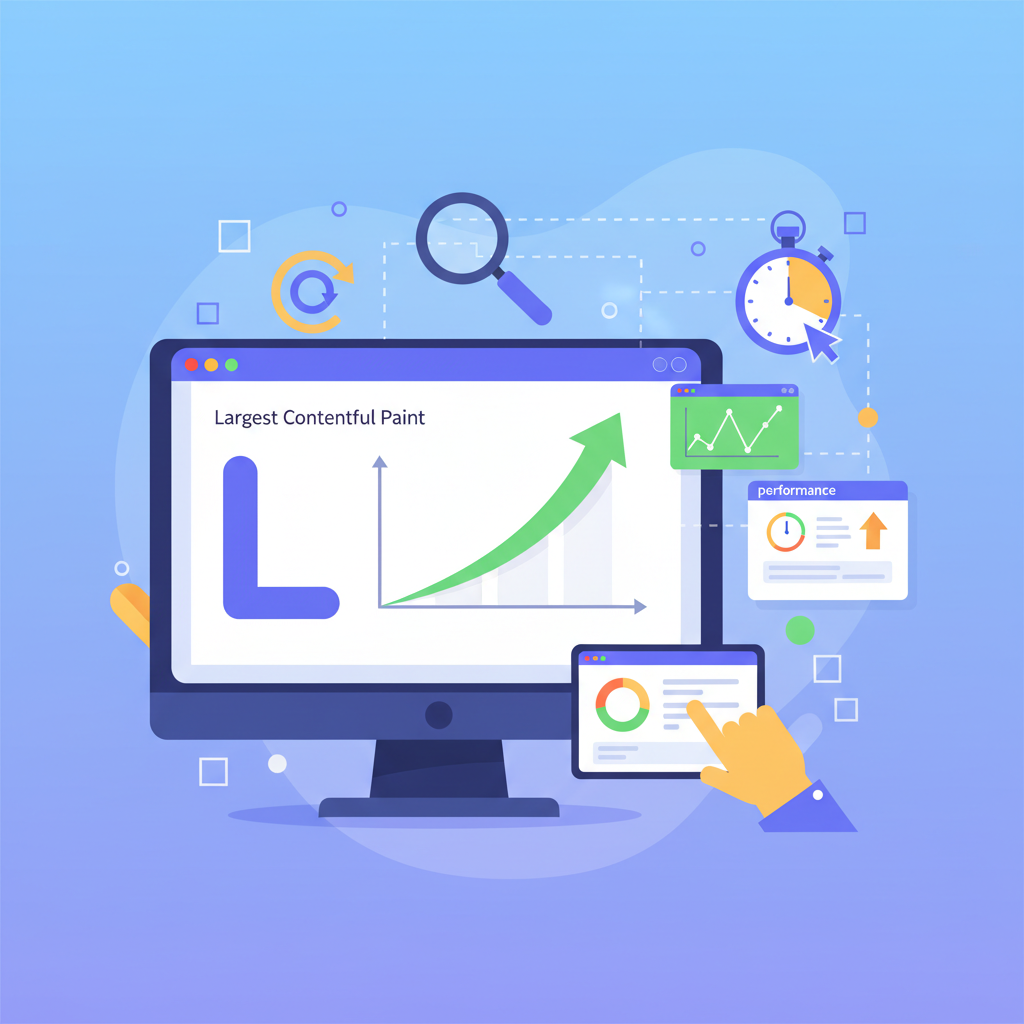
Largest Contentful Paint (LCP) measures the time from when a user initiates page load until the largest visible content element—typically an image, video, or text block—renders in the viewport, serving as a key Core Web Vitals metric for user-perceived load speed.[1][4][6] Tracking LCP helps identify performance bottlenecks, improve SEO, and enhance user experience, with good scores under 2.5 seconds on mobile.[1][4]
What is LCP and Why Track It?
LCP focuses on the render time of the page's dominant content, differing from older metrics like First Contentful Paint by prioritizing the largest element.[6] Poor LCP can increase bounce rates and harm search rankings, as Google uses it in Core Web Vitals assessments.[1][3] Tools for tracking fall into lab tools (simulated tests for controlled environments) and field tools (real-user monitoring or RUM for live data), providing complementary insights.[1][6][7]
Lab data simulates conditions via throttling, while field data from sources like Chrome User Experience Report (CrUX) reflects actual user performance.[1][3]
Lab Tools for LCP Measurement
These tools run synthetic audits to baseline performance, ideal for development and pre-launch testing.[1][6]
| Tool | Key Features | How to Use |
|---|---|---|
| Google Lighthouse | Integrated in Chrome DevTools; scores LCP with diagnostics; mobile/desktop simulation; stricter desktop thresholds.[1][4][9] | 1. Open DevTools > Lighthouse tab. 2. Select Performance category and device. 3. Generate report. 4. Check "Largest Contentful Paint" metric for time and optimizations.[1] |
| PageSpeed Insights | Combines Lighthouse lab data with CrUX field data; actionable recommendations.[1] | 1. Visit pagespeed.web.dev. 2. Enter URL and analyze. 3. Review LCP in Performance section (lab vs. field).[1] |
| WebPageTest | Granular control over networks, devices, browsers; detailed waterfalls for LCP elements.[1][7] | Configure test settings (e.g., 4G throttling), run analysis, and inspect LCP in filmstrip view.[1] |
| GTmetrix | Lighthouse-based; focuses on optimizing largest images/text blocks.[9] | Enter URL for report highlighting LCP contributors. |
| Sitechecker | Unified dashboard for mobile/desktop LCP, PageSpeed scores, and SEO health.[5] | Enter URL; get instant mobile/desktop analysis and page score.[5] |
Lighthouse determines LCP via Chrome's tracing tool, categorizing scores as green (≤2.5s), orange (2.5-4s), or red (>4s) on mobile.[4]
Field and RUM Tools for Real-User LCP Tracking
These capture live data, revealing issues lab tools miss, like regional variances.[2][3][7]
- DebugBear: RUM dashboards break down LCP subparts (e.g., load delay, render delay); tracks trends, page-specific issues, and visitor distributions.[2]
- Calibre: CrUX dashboards for LCP over time; competitor comparisons; synthetic tests for low-traffic pages.[3]
- Google Search Console: Core Web Vitals report aggregates CrUX field data for LCP pass/fail rates.[7]
- Catchpoint: Supports both lab (synthetic) and field monitoring; integrates with real-user traffic.[7]
Monitor regularly, especially post-changes, using these for ongoing trends.[1][3]
JavaScript-Based Programmatic Tracking
For custom integration, use browser APIs or libraries to measure LCP in production.
// Using Largest Contentful Paint API
new PerformanceObserver((entryList) => {
  for (const entry of entryList.getEntries()) {
    console.log('LCP candidate:', entry.startTime, entry);
  }
}).observe({type: 'largest-contentful-paint', buffered: true});
The web-vitals library simplifies this, handling edge cases like prerendering:
import {getLCP} from 'web-vitals';
getLCP(console.log);  // Logs LCP value
Log values for reporting to third-party tools.[6][7]
Browser Extensions and Additional Tools
- LCP & CLS Monitor (Chrome extension): Real-time visual highlighting of LCP/CLS issues with red borders on problematic elements.[8]
Best Practices for LCP Tracking
- Compare lab and field data for holistic views.[1]
- Track LCP subparts to pinpoint delays (e.g., resource load vs. render blocking).[2]
- Test across devices/networks; aim for consistent <2.5s.[1][4]
- Integrate RUM for production insights and synthetics for CI/CD.[3][7]
Regular use of these tools ensures optimized LCP, boosting engagement and rankings.[1][3]
No comments:
Post a Comment